Als Erweiterung zum Blogpost vom letzten Herbst, hier die Monatskarten mit der Windstatistik für die erste Jahreshälfte. Neu sind die Zusatzinformationen zu Flaute, Temperatur und Starkwindböen. Außerdem habe ich noch einige Gebiete angepasst/ergänzt. Außerdem basiert die Statistik jetzt auf der 0.125° (etwa 7.5nm bzw. 14km) Reanalyse.
Achtung: Die hier gezeigten Werte basieren auf eine langjährigen Statistik. Das schließt nicht aus, dass Starkwind und Sturm jederzeit auftreten können. Es liegt in der Verantwortung jedes Wassersportlers aktuelle Wetterinformationen einzuholen und die Aktivität entsprechend zu gestalten.
Download der hochaufgelösten Version: wind_statistics_baltic_sea.pdf
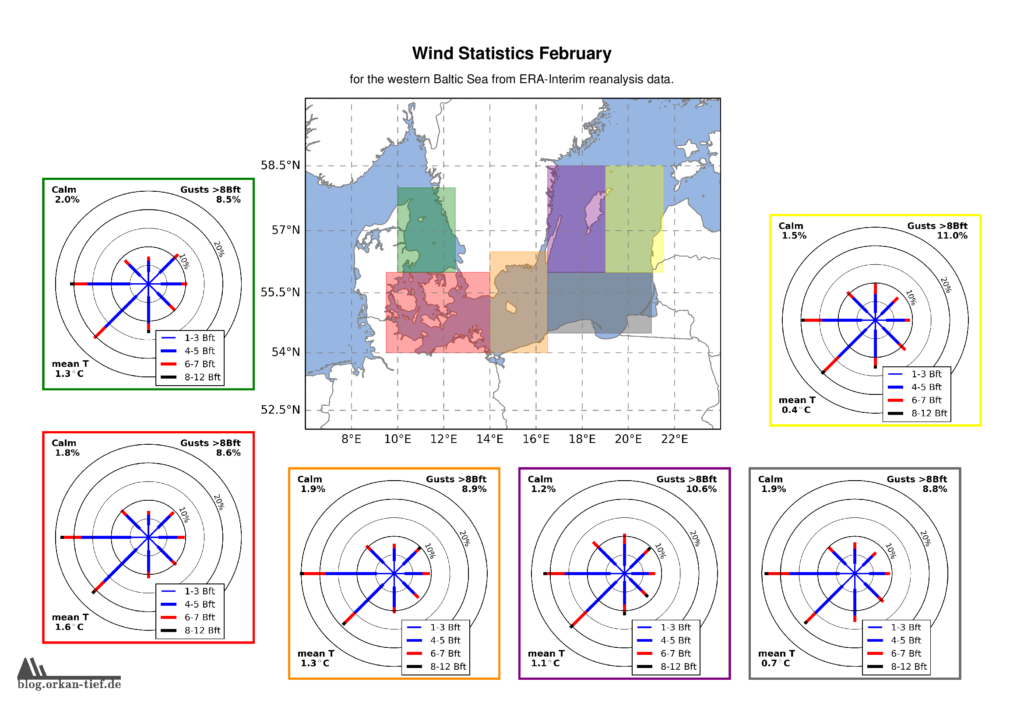
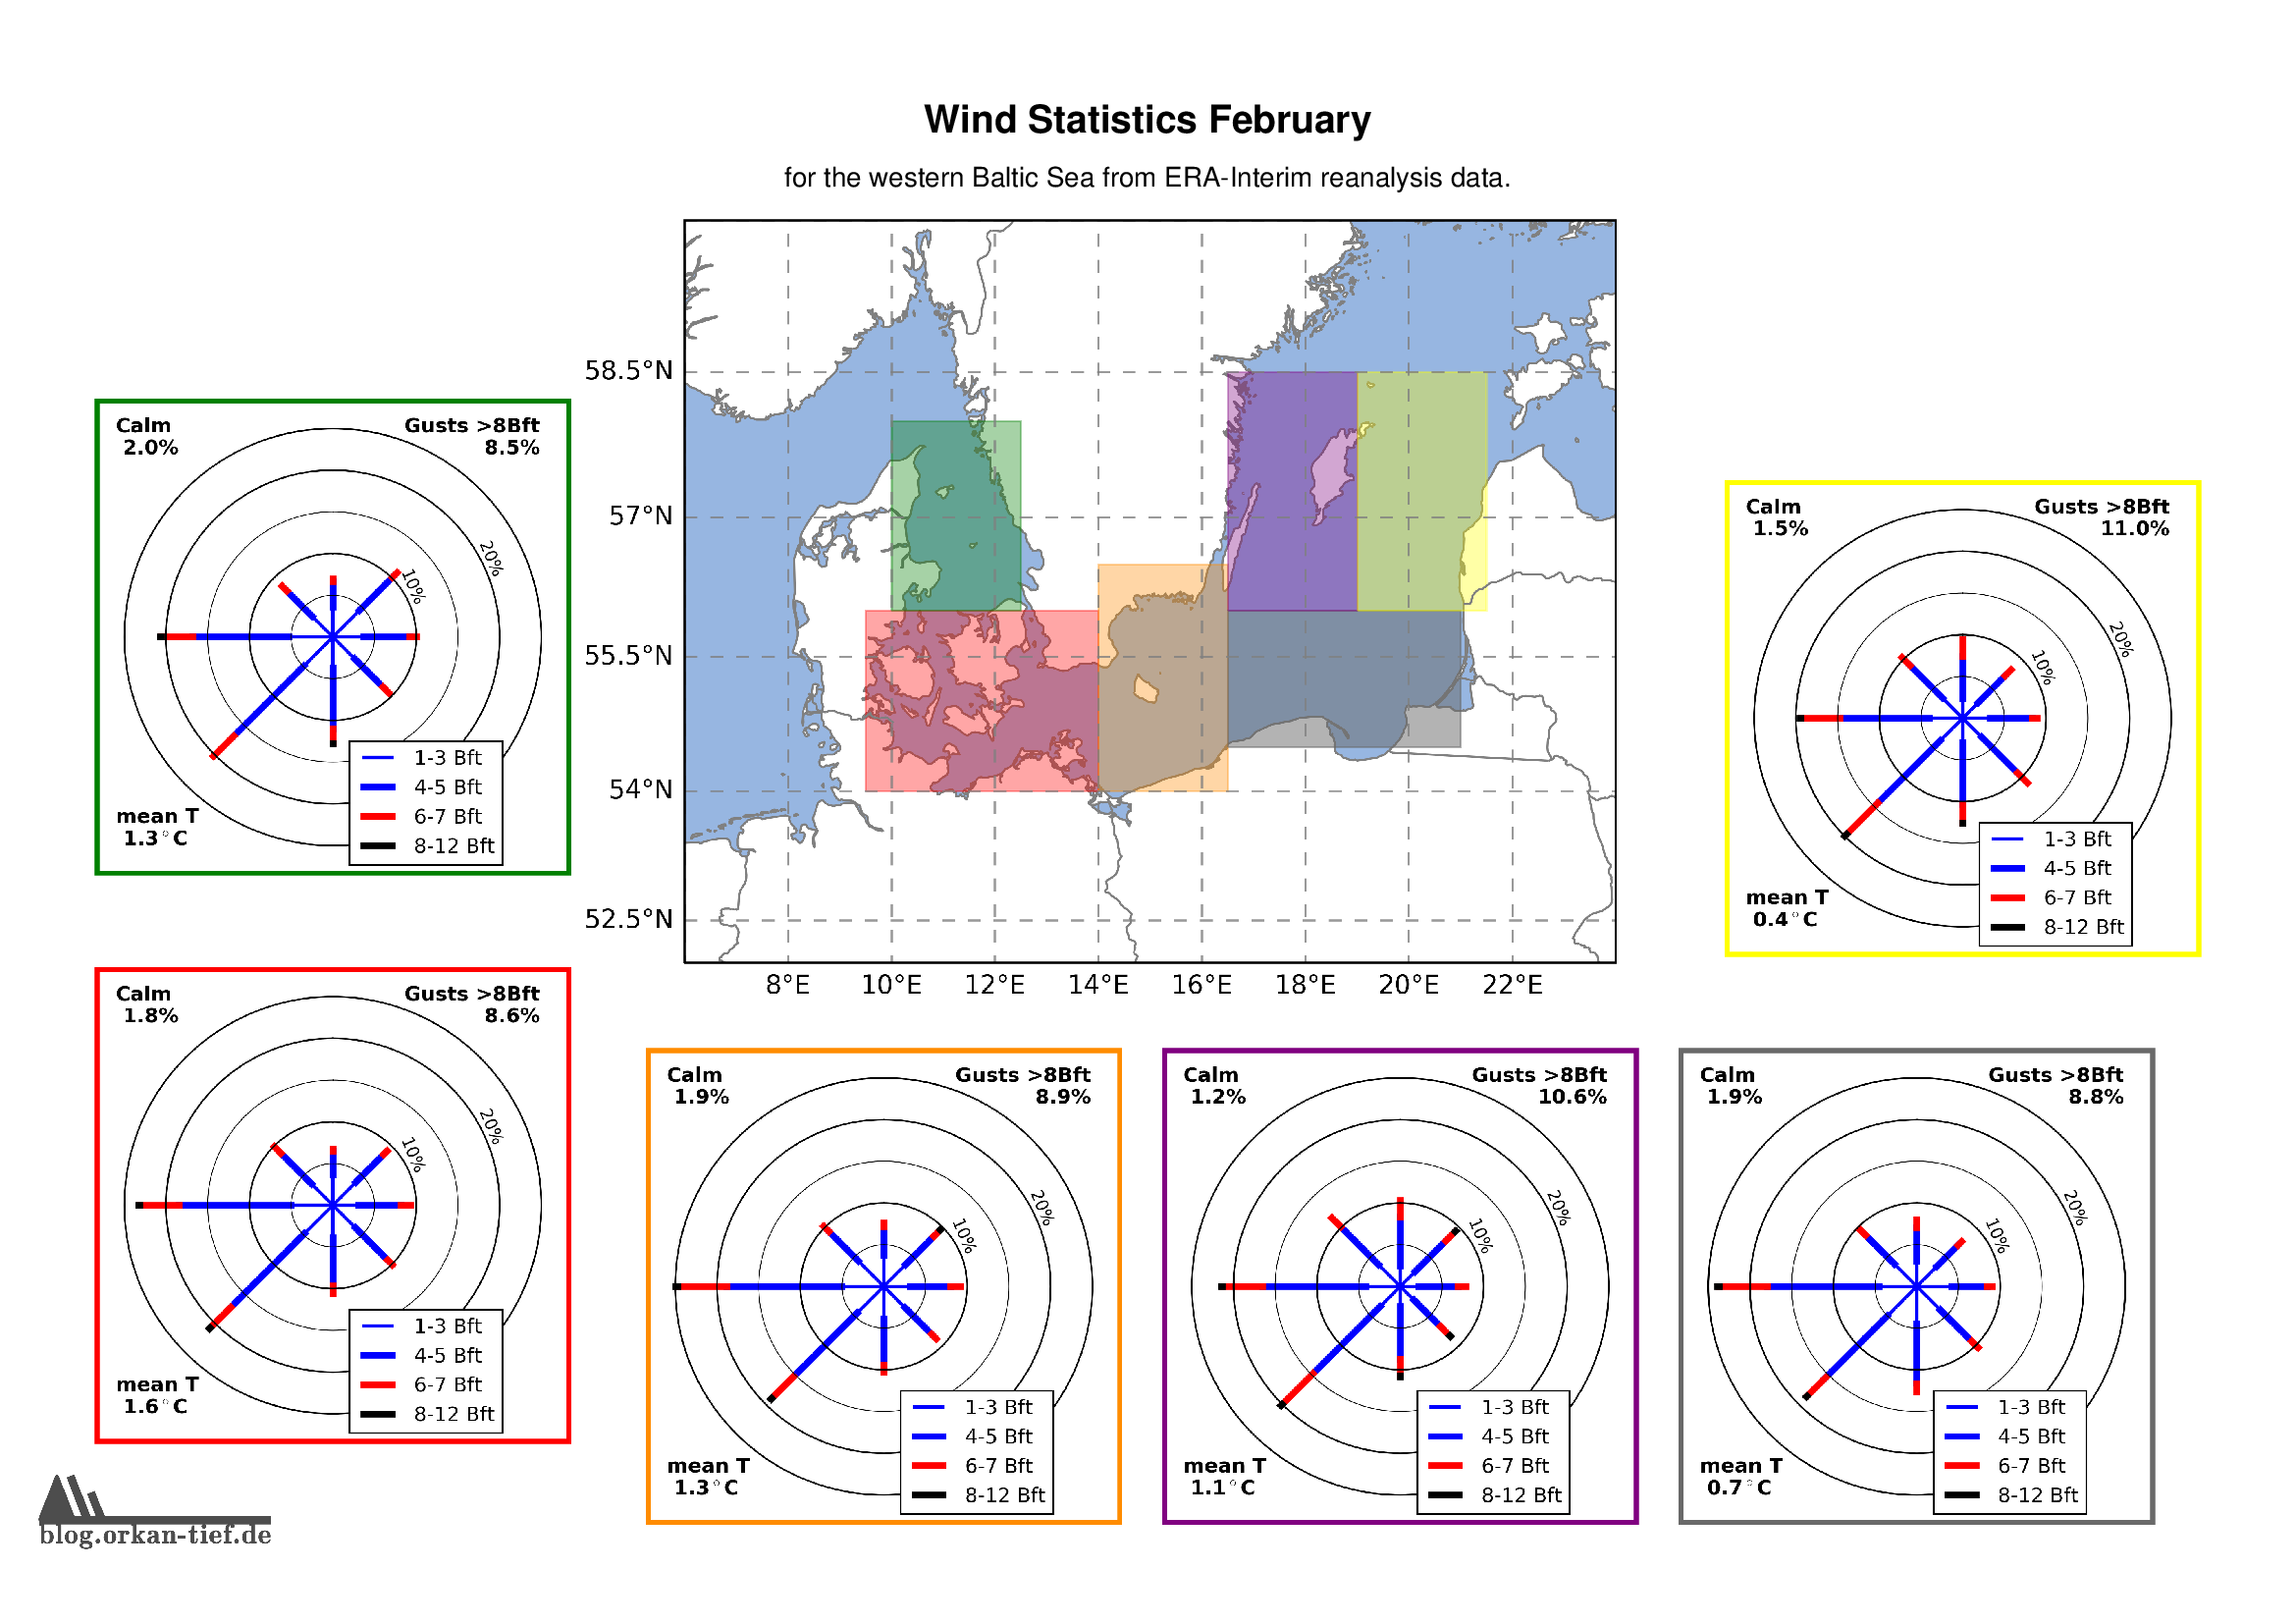
Februar
 März
März
 April
April


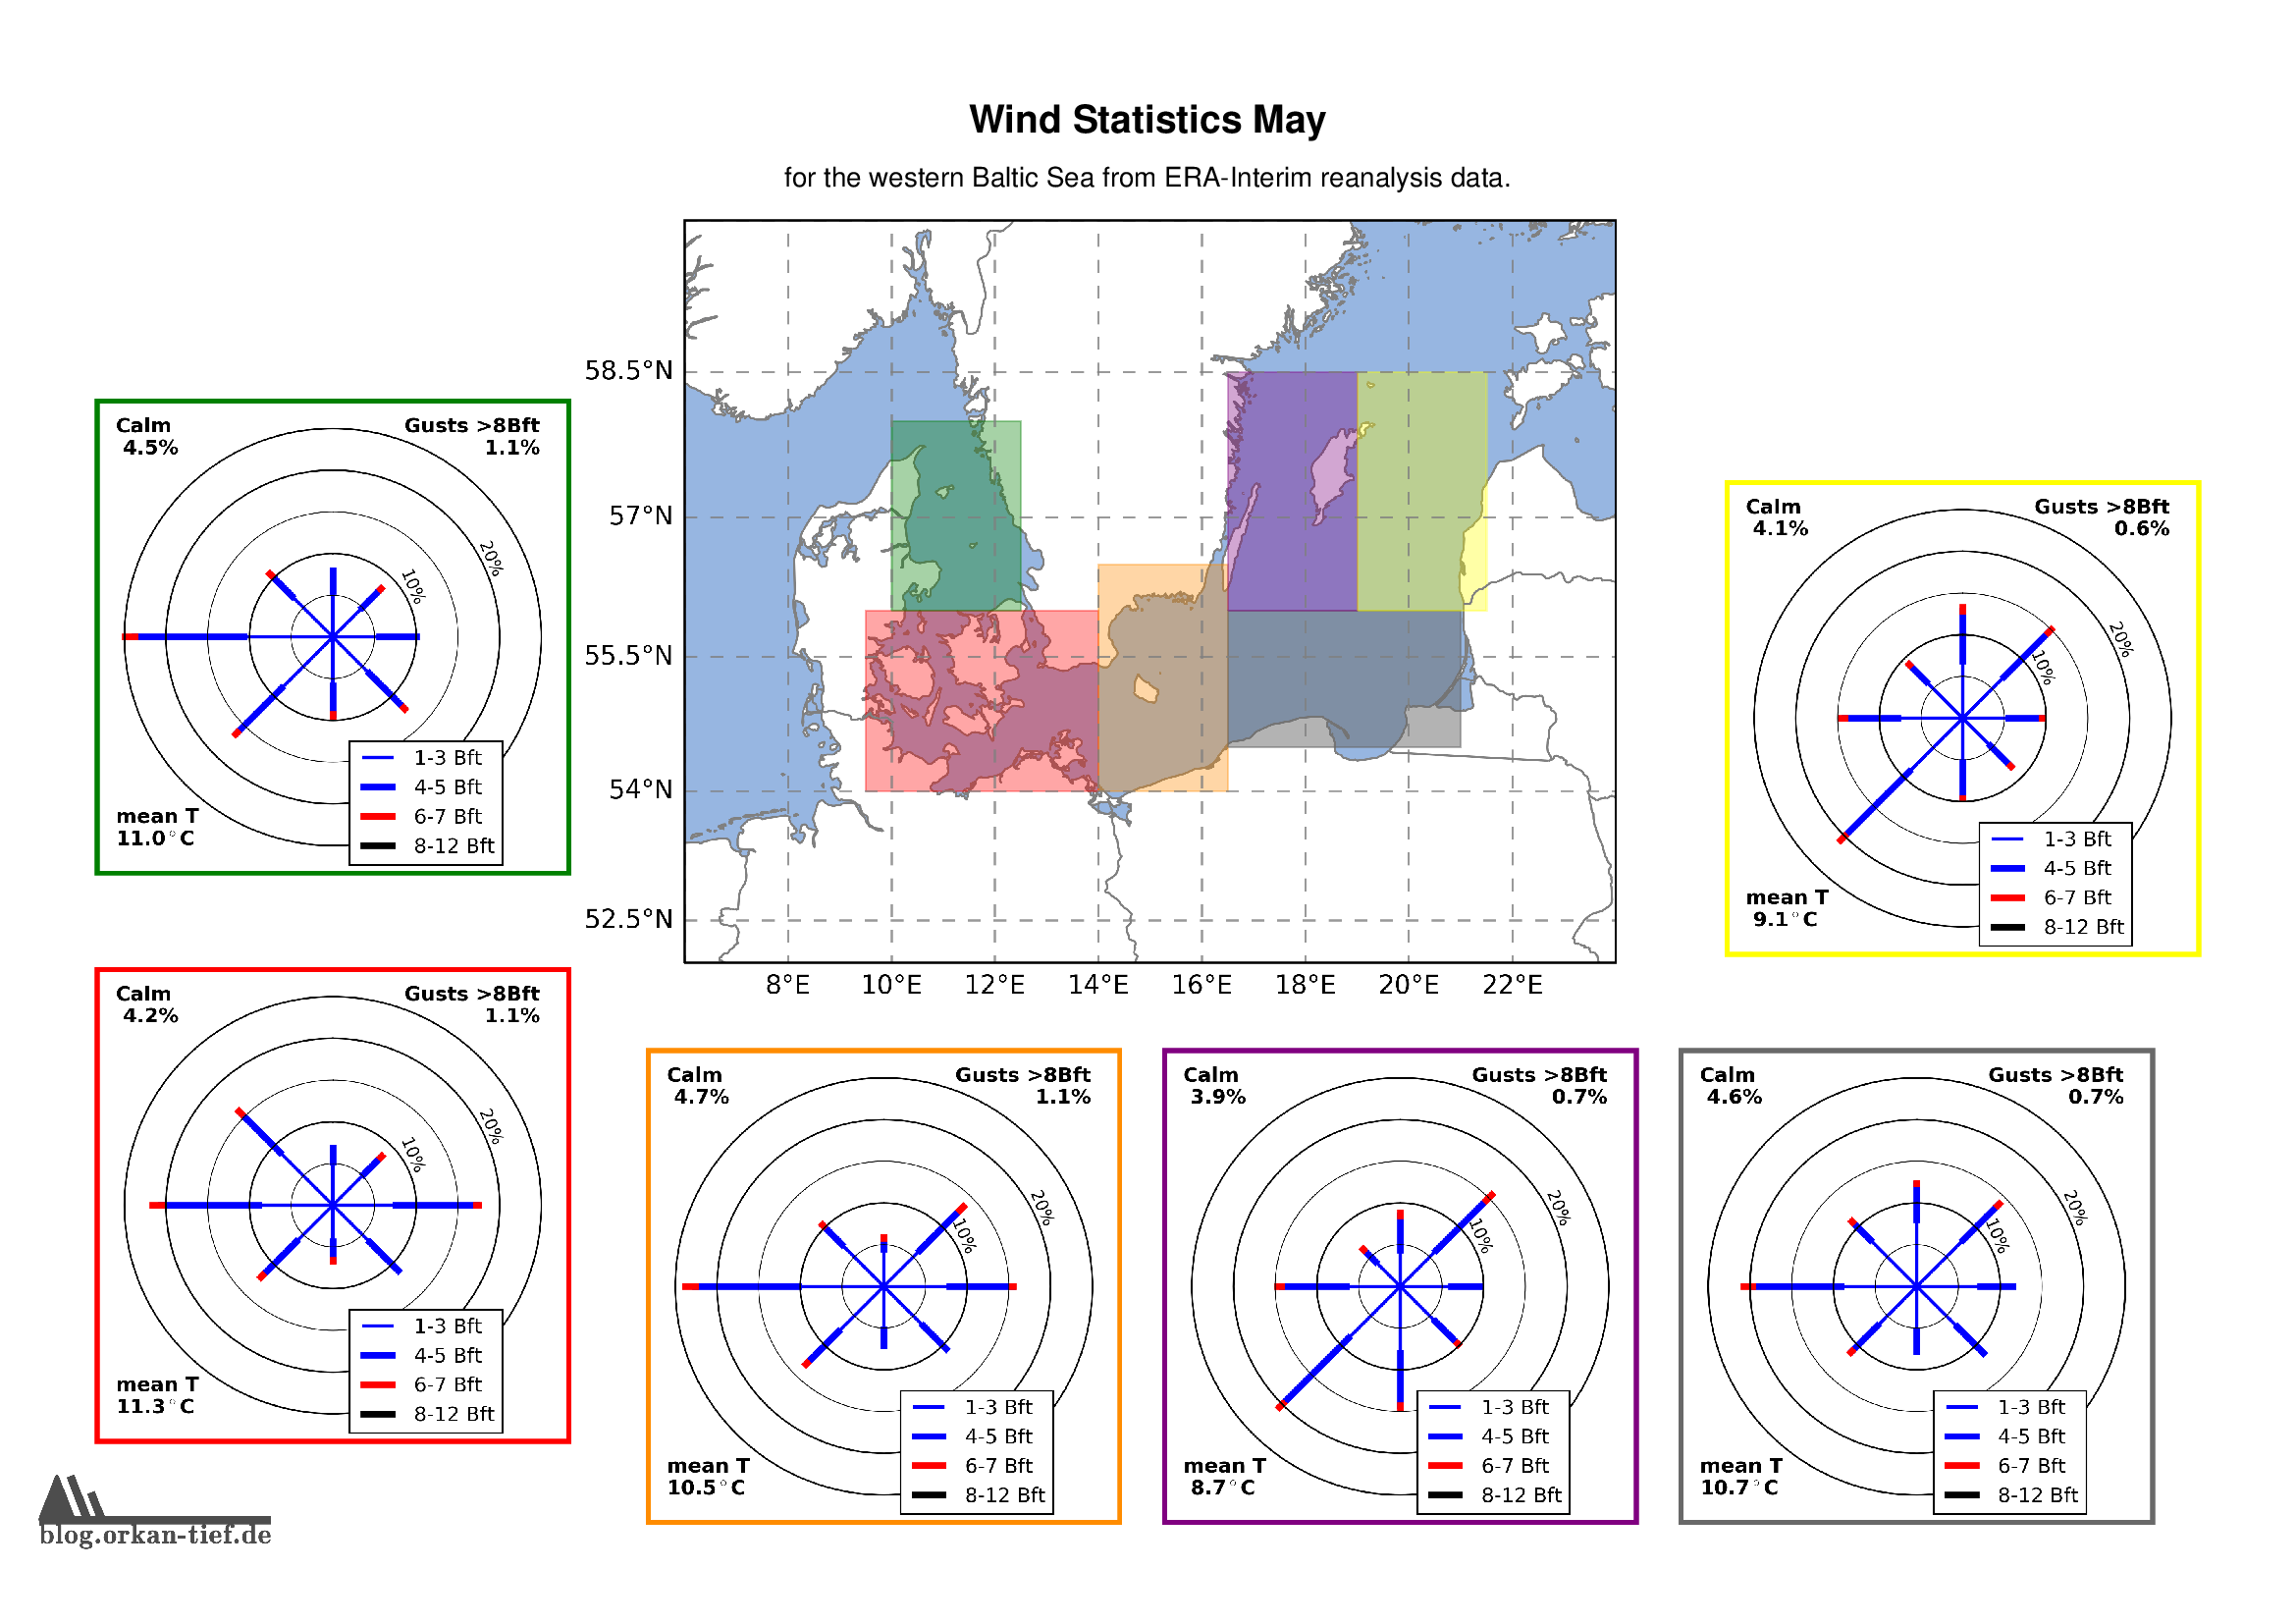
Mai
Juni
